Understanding the Healthy Eating Index and why it matters
This blog explains what the Healthy Eating Index (HEI) is, why it matters, how researchers and health professionals use it, and its limitations and alternatives.

When it comes to healthy eating, a couple of specific food groups come to mind—fruits and vegetables, anyone? But defining and measuring “healthy eating” can be more complex and nuanced than you might expect. Enter the Dietary Guidelines for Americans and the Healthy Eating Index (HEI).
In the United States, the Dietary Guidelines for Americans (PDF) is the primary tool the government uses to define the components of a healthy eating pattern. The dietary guidelines synthesize current nutritional science into practical dietary guidance to help the average American live a healthy lifestyle and decrease chronic disease risk. In fact, the dietary guidelines undergird every federal food and nutrition program.1
The HEI, then, is the tool that attempts to quantify and measure healthy eating. But what exactly is the HEI, and why does it matter?
In this blog, we discuss healthy eating from a public health and population-level perspective. For more practical tips on healthy eating for individuals, browse our other healthy eating blogs.
What is the Healthy Eating Index?
If you’ve read a handful of scholarly nutrition research articles or closely examined the Dietary Guidelines for Americans, you might have come across the “Healthy Eating Index.” The HEI is a dietary quality index that quantifies how well any mix of foods adheres to the Dietary Guidelines for Americans.2
For example, the HEI can score the average American diet on a scale from 0-100—a score of 100 meaning that the diet completely meets the recommendations outlined in the Dietary Guidelines. The HEI is used to assess diet quality, and the ability to measure diet quality makes the HEI a valuable tool for researchers and public health professionals.
History and Evolution
The HEI, first released in 1995, was developed through a collaboration between the Center for Nutrition Policy and Promotion (CNPP) housed within the US Department of Agriculture (USDA) and the National Cancer Institute (NCI) housed within the US Department of Health and Human Services (DHHS).3
The HEI is not a static tool. Since it is designed to reflect adherence to the Dietary Guidelines for Americans, which is updated every five years, the CNPP and the NCI revise the HEI to align more closely with the Dietary Guidelines for Americans. The most updated version of the HEI is the HEI-2015 which corresponds to the 2015-2020 Dietary Guidelines.
The USDA and DHHS released the latest iteration of the Dietary Guidelines for Americans in December 2020. Read more about what you need to know about the 2020-2025 Dietary Guidelines for Americans.
The first version of the HEI was unique from all other versions. The CNPP produced it without input from the NCI, and it had a significantly different structure than the subsequent versions. The HEI-2005, HEI-2010, and HEI-2015, on the other hand, share characteristics that give the HEI its current flexibility. From 2005 onward, the HEI is density-based, meaning that you can calculate diet quality for any mix of foods, regardless of amount.4 This feature of the HEI opens up the door to the many applications outlined in a following section.
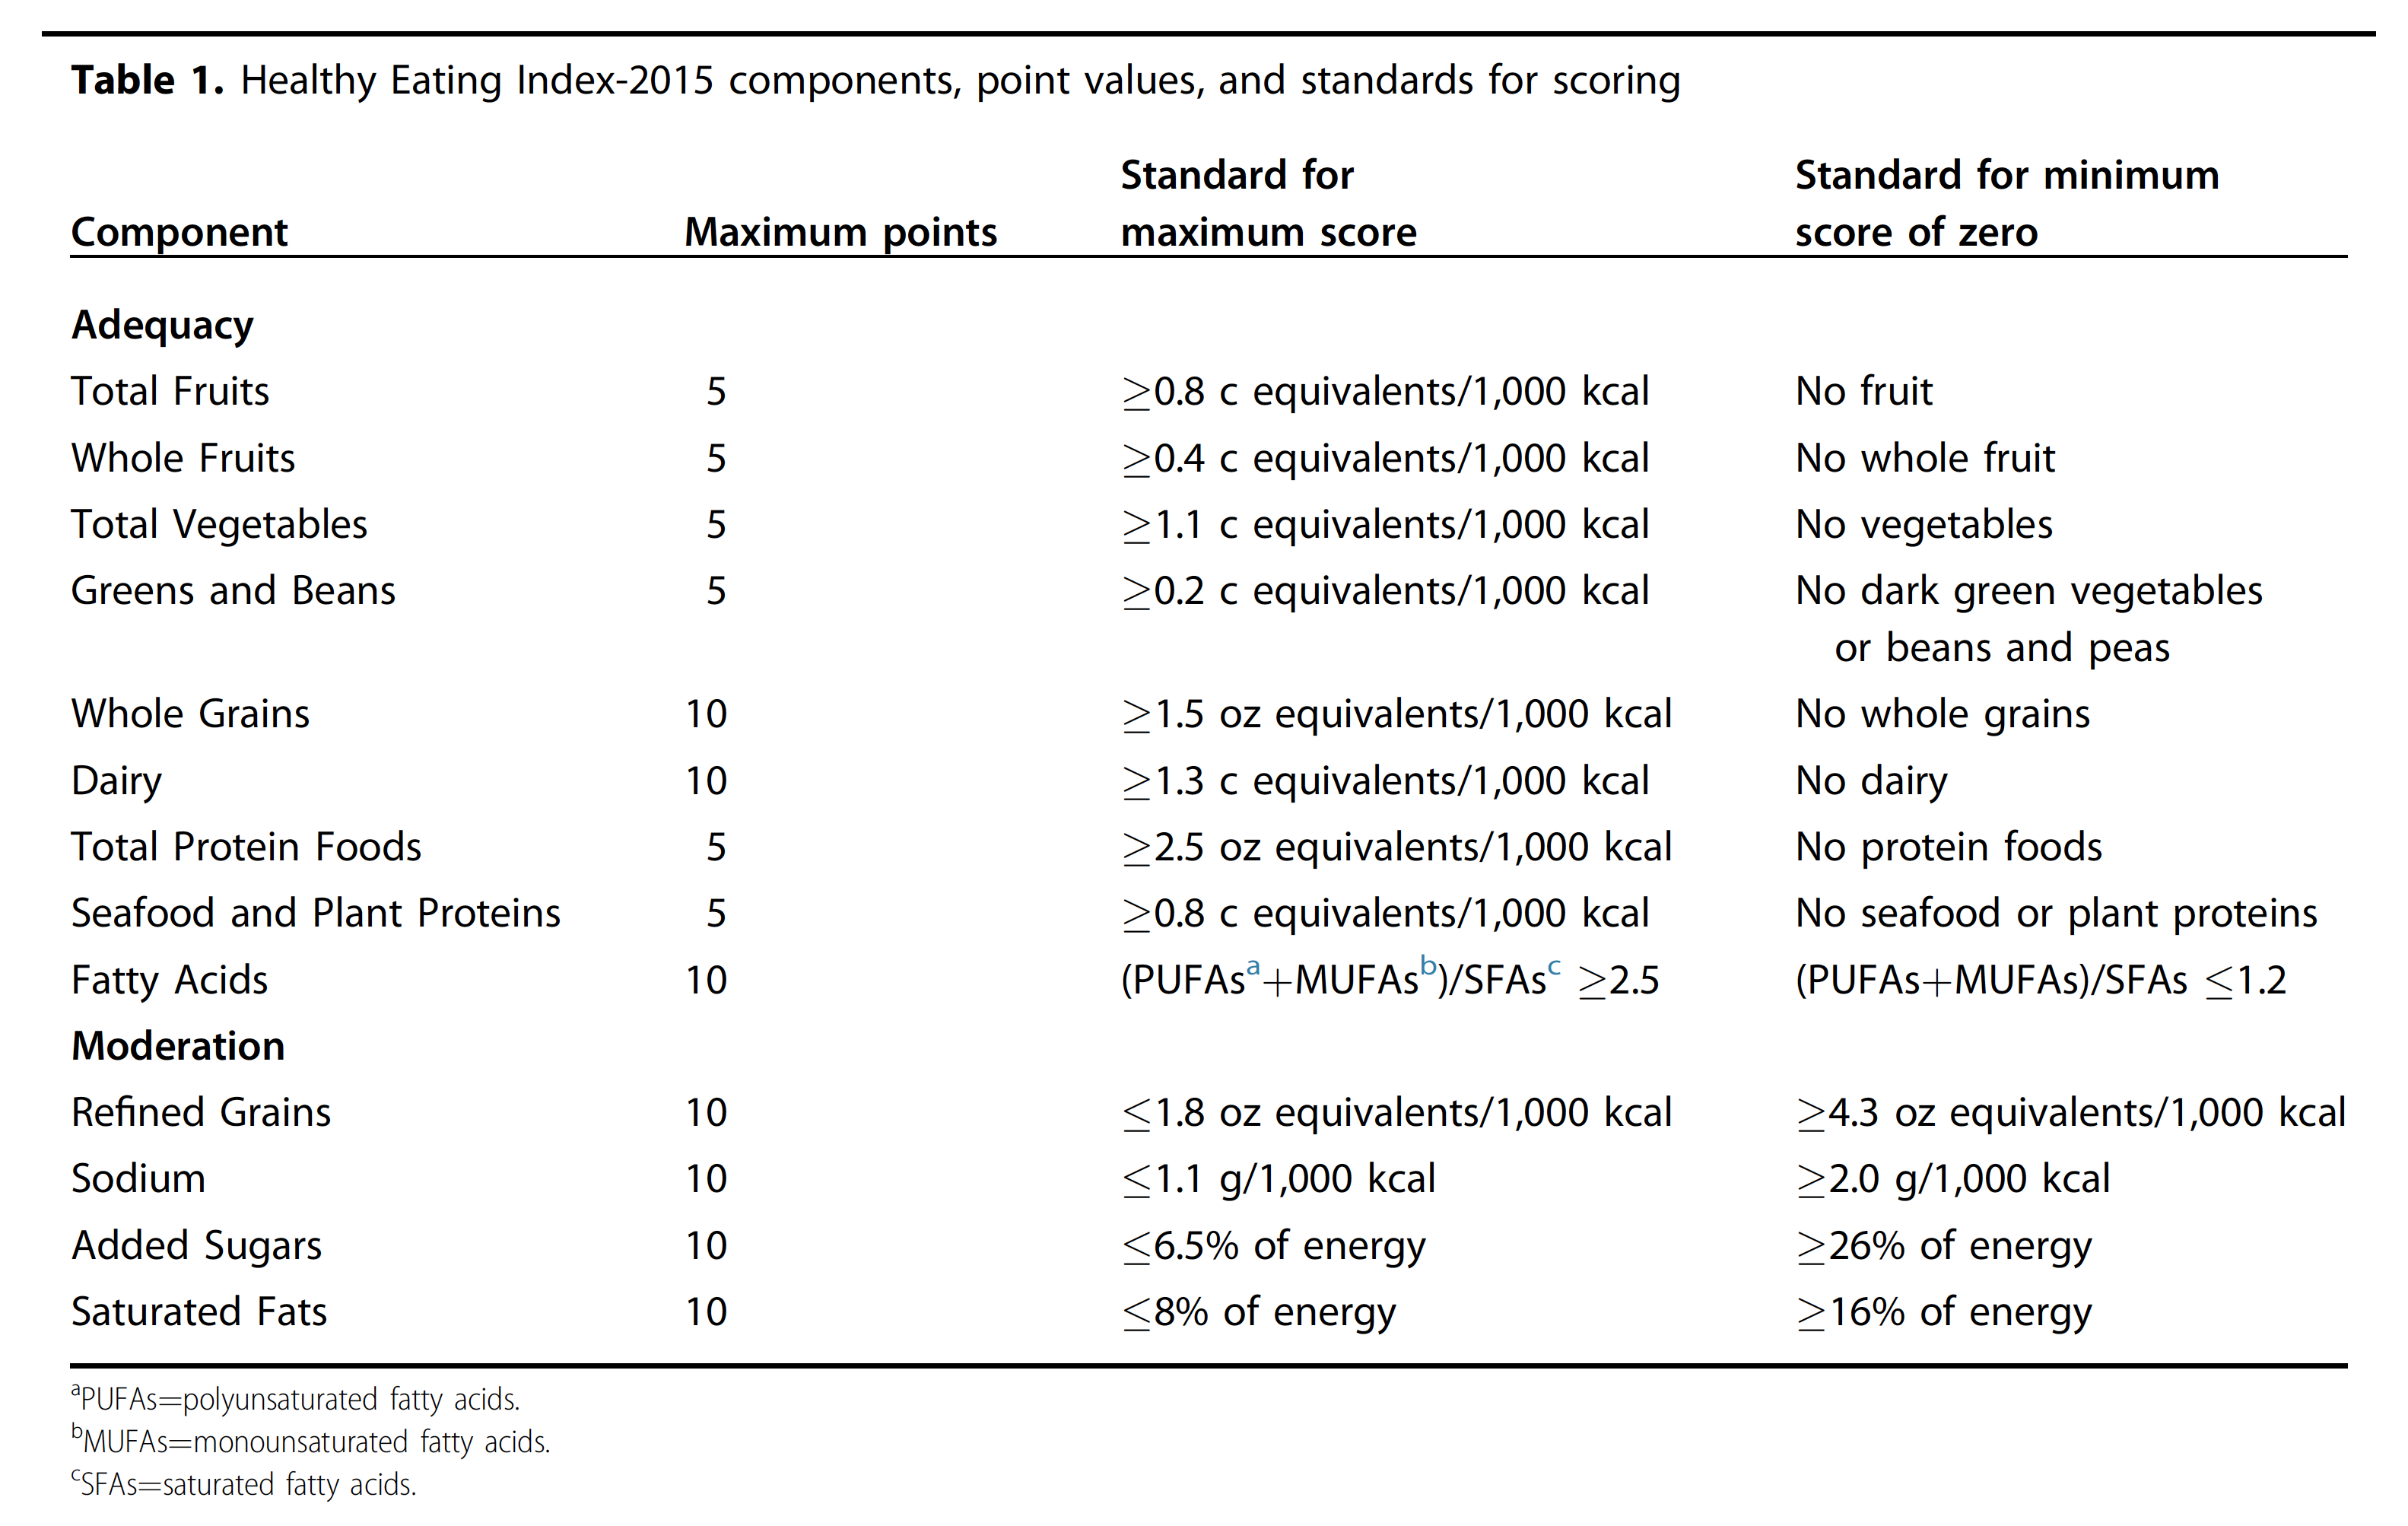
HEI-2015 & Scoring the American Diet
So, how does the HEI work? Simply put, the HEI-2015 is made up of 13 components that are roughly aligned to the USDA food groups.5 Each component is assigned a point value, with all 13 components adding up to 100 possible points.6
You can further subdivide the 13 components into nine adequacy and four moderation components. Adequacy components address the foods and nutrients in the diet that the dietary guidelines encourage eating in greater quantities. Higher scores in adequacy components reflect higher intake. Moderation components address the foods and nutrients that you are encouraged to consume less of, so higher scores for moderation components reflect lower intake.
Changes in the HEI-2015
The main change from the HEI-2015 from the HEI-2010 is dividing the “empty calories” component from the previous iterations of the index into two parts: “saturated fats” and “added sugars.” While the empty calories component accounted for 20 points, the two new components account for 10 points each to maintain the same relative influence on the total score. Additional changes include counting legumes towards both the vegetable and protein components and removing alcohol intake from being measured directly.
Validating the Healthy Eating Index
One question you might be asking—how do we know if the HEI-2015 measures anything valuable? To make sure the HEI captures what it was designed to capture, researchers validate the measure for construct validity, reliability, and criterion validity.7
Consider this scenario: You just got your grade back for an exam where you studied really hard. You failed. It’s not that you didn’t know the material; instead, the test could not accurately assess your understanding of the material. The exam lacked construct validity.
- Construct Validity is a term that asks the question: how well does the HEI-2015 actually quantify a healthy diet, as defined by the DGA? In a 2018 study, researchers used the HEI-2015 to score high-quality meal plans designed by nutrition experts. These sample menus included: the USDA food patterns, The Dietary Approaches to Stop Hypertension (DASH) diet, Harvard Medical School’s Healthy Eating Guide, and the American Heart Association’s No-Fad diet. The HEI returned scores between 87.8 to 100 for the sample menus, showing that the index returns high scores for high-quality menus. The study also showed that the HEI-2015 could assess diet quality independent of quantity.
- Reliability was assessed to measure the internal consistency of the HEI-2015. That is, how the individual components relate to each other and influence the total score.
- Criterion Validity asks the question: how well do the generated scores align with specific outcomes? In the case of the HEI-2015, how well do HEI-2015 scores correlate with or predict health outcomes? This question is critical. After all, the goal of the DGA is to promote health and prevent disease through a healthy dietary pattern, so it is essential to know how well the HEI correlates with chronic disease risk and mortality. A study evaluating HEI-2015 criterion validity found that those in the top 20% for diet quality had a 13% to 23% lower risk of dying from all causes, cancer, and heart disease than those in the bottom 20%.
In the next section, we’ll talk about diet quality, asking the question: why does measuring diet quality matter?
Why does the Healthy Eating Index matter?
We’ve established that the HEI helps us measure diet quality. Now we need to clarify the why. The goal of public health nutrition is health promotion and disease prevention, and diet quality has been linked to chronic disease risk time and time again. The Center for Disease Control and Prevention (CDC), for example, links poor nutrition to adverse health outcomes like heart disease, stroke, type 2 diabetes, cancer, and decreased brain function.8
As discussed in the previous section, The HEI has been validated against certain diet-related chronic diseases. A 2020 meta-analysis found that diets that scored highly on the HEI-2015 were associated with lower risks of all-cause mortality, heart disease, and cancer.7,9
Consequentially, dietary quality scores emphasize overall dietary patterns rather than intakes of specific foods and nutrients. Not only is the dietary pattern method likely a better predictor of disease risk, but it is also a more inclusive and sustainable approach to good nutrition. In the article Diet Quality: The Key to Healthy Eating, the authors state5:
“Diet quality focuses on the totality of what one eats and drinks; it examines healthy eating patterns as a whole, with the aim to bring about lasting improvements in individual and population health.”
Ultimately, the HEI matters because it allows us to describe American diet quality and predict chronic disease risk. The relationship between dietary quality and improved health outcomes is essential in understanding the value of the HEI as a public health tool. Using HEI scores as a benchmarking tool allows public health professionals to determine how well relevant interventions lower diet-related chronic disease risk and where additional resources could generate the most impact. Let’s drill down into these use cases a bit further.
How is the Healthy Eating Index used?
Researchers and health professionals have used the HEI in various ways to evaluate different dimensions of diet quality.1,10 Because all versions of the HEI after 2005 are density-based, the HEI can theoretically be used to assess any mix of foods from an individual’s diet to the national food supply.11 Here are six ways the HEI has been used:
Diet and chronic disease
The HEI can be used to evaluate the relationship between diet quality and the risk of developing or dying from a chronic disease, as previously discussed.
Population diet quality
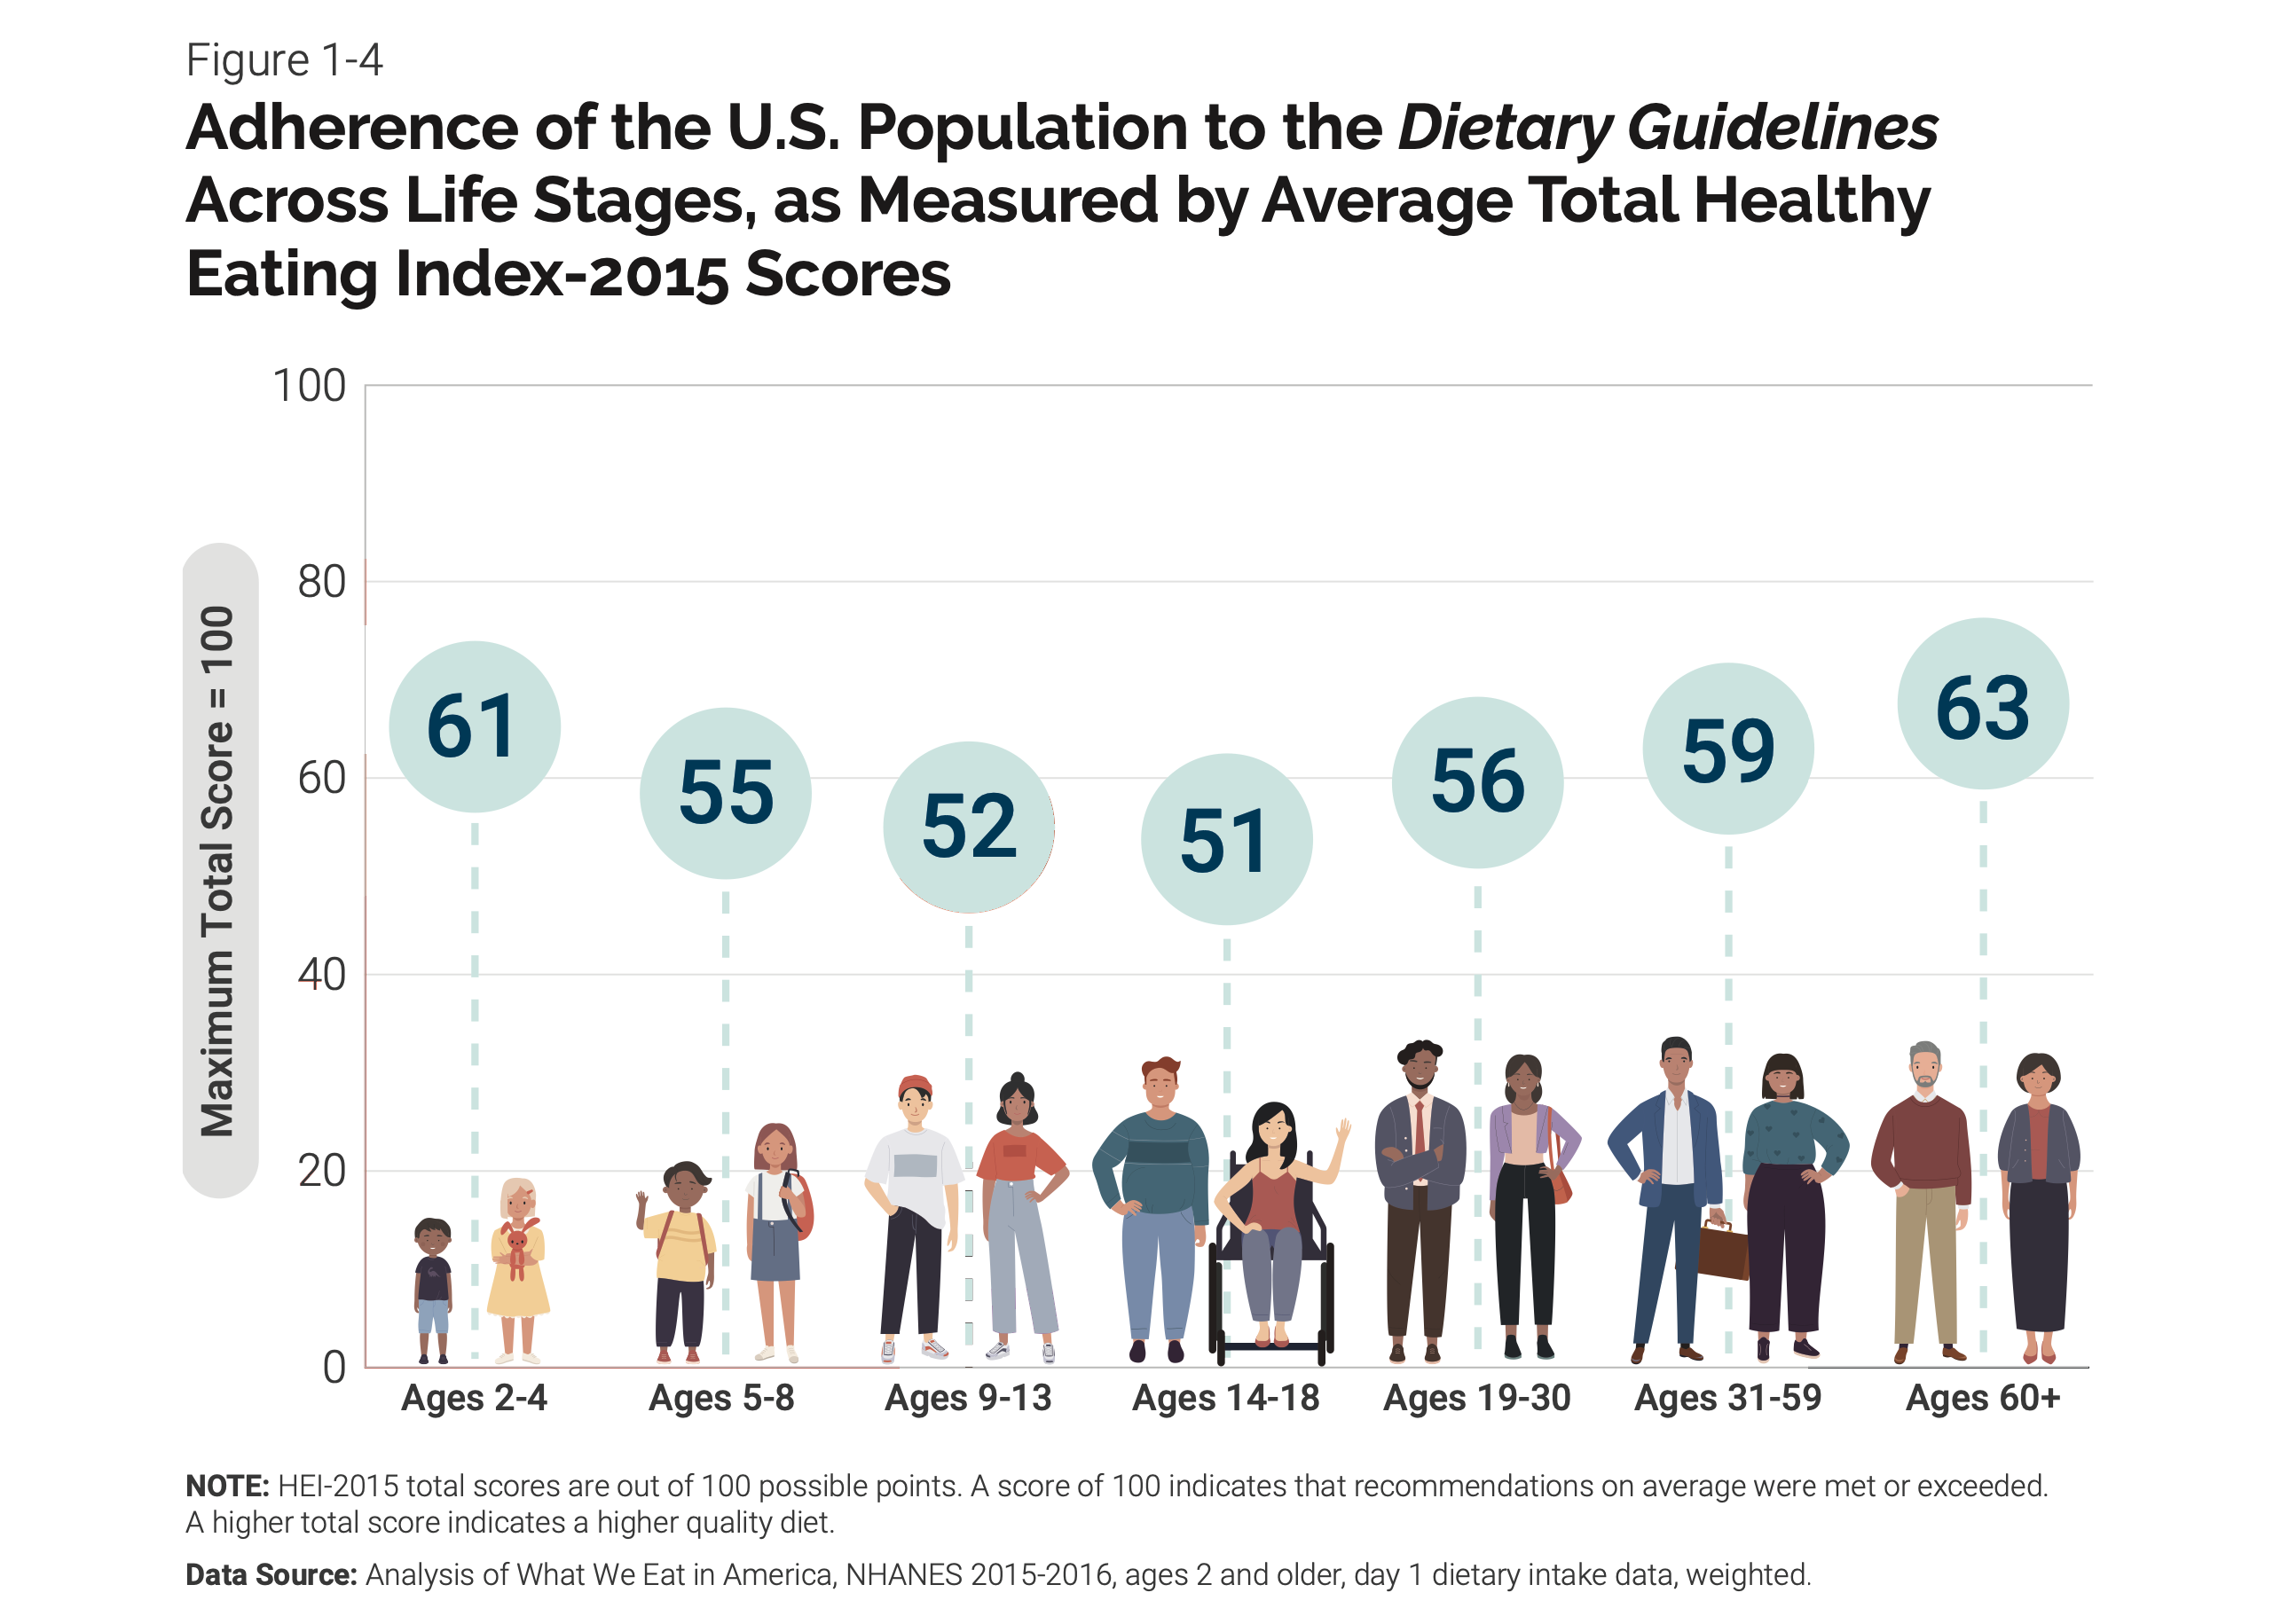
One common way the HEI is used is to answer the question, “What is the quality of the average American diet on a scale of 1-100?” The answer, by the way, is 59.12 The HEI is well-suited to determine adherence to the Dietary Guidelines in the US population as a whole and subpopulations of interest across different ages, genders, racial groups, and more. The latest version of the Dietary Guidelines includes an infographic that compares diet quality across age groups using the HEI-2015.13
Research Interventions
The HEI can also be used to examine the effect of an intervention on diet quality. For example, a randomized clinical trial used the HEI-2005 to measure diet quality at three-month intervals during an 18-month intervention and found that HEI-2005 scores increased 7.2 points in the intervention group versus the control.14
Food environment
The HEI has also been used to determine the diet quality of the US food environment, including the US food supply, restaurant menus, and federal nutrition programs.
A 2014 study found that the US food supply between 1970 and 2010 improved from an HEI score of 48 to 55, but the improved score was still not consistent with national dietary guidance.15 Similar calculations have been done for fast food restaurant menus.16 Having this kind of data can be influential in improving the food environment or the context in which people make choices about what to eat. HEI data may also motivate restaurants and food companies to improve the quality of their menus and products.
Additionally, The HEI can be used to quantify the quality of food made available in government programs like the Supplemental Nutrition Assistance Program (SNAP), the National School Lunch Program (NSLP), and the Supplemental Nutrition Program for Women, Infants, and Children (WIC).1,6
National and International Goals
The HEI can be used to set benchmarks and measure progress towards national diet quality goals. The nutrition-related Healthy People objectives set by the government are based on the guidance presented in the Dietary Guidelines. Healthy People “identifies public health priorities to help individuals, organizations, and communities across the United States improve health and well-being.” A subset of these public health goals is focused on nutrition. While we are now on to the Healthy People 2030 objectives, a 2016 research paper found that an HEI-2010 total diet score of 74 would be necessary to meet the Healthy People 2020 nutrition targets.17
Several of the United Nations Sustainable Development Goals (SDGs) also require improvements in food and nutrition to protect against chronic disease and improve maternal and child health. The HEI is one of few validated indices that have shown protective effects against certain chronic diseases and can be a useful tool to quantify diet quality globally.18 However, there are limitations to the use of the HEI, as described below.
Global applications
Though the CNPP and NCI designed the HEI for use in the United States, the component food groups are considered “culturally neutral.” Several other countries have used either a local adaptation of the HEI or the HEI as-is to assess diet quality.1
Limitations of the Healthy Eating Index
While researchers and health professionals have used the HEI in several different ways, the tool is not without its limitations. When measuring complex concepts like diet quality, a one-size-fits-all approach won’t work. Here are a few limitations of the HEI that you might want to consider when interpreting HEI scores:
- Based on the US population: While countries around the globe have used the HEI, it was explicitly designed to address adherence to the Dietary Guidelines for Americans, so it may lack cultural appropriateness. Additionally, a 2018 study found that the HEI-2015 was suitable for predicting decreased risk of dying from all causes, heart disease, and cancer in a multiethnic population. However, the protective effect of high diet quality was more pronounced in white and Black Americans—subpopulations that have received more attention in scientific literature.19
- Not designed for individuals: The HEI is based on population-level data and recommendations. Although HEI scores can be used in clinical settings, the score does not take into account individual nutrition needs, which limits its usefulness for individuals.6,20
- Subject to confounding: Overall health is not just the result of eating a healthy diet. Several other aspects of an individual’s lifestyle and circumstances, such as socioeconomic status, genetics, access to healthcare, the food environment, and more, can influence diet quality and overall health outcomes.21
Alternatives to the Healthy Eating Index
The HEI isn’t the only tool used to evaluate diet quality. There are plenty of other available metrics, but only a few have been validated against health outcomes. All the validated measures of diet quality tend to have in common an emphasis on healthy plant foods like fruits, vegetables, whole grains, nuts, and legumes. Commonly used validated diet quality indices include the Alternative Healthy Eating Index (AHEI), the Mediterranean Diet Score (MED), and the Dietary Approaches to Stop Hypertension (DASH) score.18
AHEI
Researchers designed the Alternative Healthy Eating Index (AHEI) in 2002 to create a diet quality measure that aligned better with chronic disease risk reduction.22 Now in its second edition, high scores on the AHEI-2010 have been associated with lowered risk of neurodegenerative disease, among other benefits.9,18
MED
The Mediterranean Diet Score (MED or MDS) was designed to measure adherence to the Mediterranean diet. There are several versions of the MED score in circulation, and high scores have been associated with decreased risk of stroke in addition to all-cause mortality, cardiovascular disease risk and mortality, type 2 diabetes, and cancer mortality.18
DASH
The Dietary Approaches to Stop Hypertension (DASH) score was developed to measure adherence to the DASH diet, an evidence-based dietary pattern designed to lower or prevent high blood pressure. The most commonly used version in US academic articles is the DASH-Fung score, and high scores on the DASH metric have been linked to lower risks of type 2 diabetes when compared to risk reduction using the HEI or the AHEI.9,18
Conclusion
All in all, The HEI is a common way—but not the only or perfect way—to think about and measure diet quality, specifically via adherence to the Dietary Guidelines for Americans. The HEI can be used all across the food stream to evaluate the diet quality of any mix of foods. And diet quality is important, ultimately, because it has consequences for our health and well-being.